
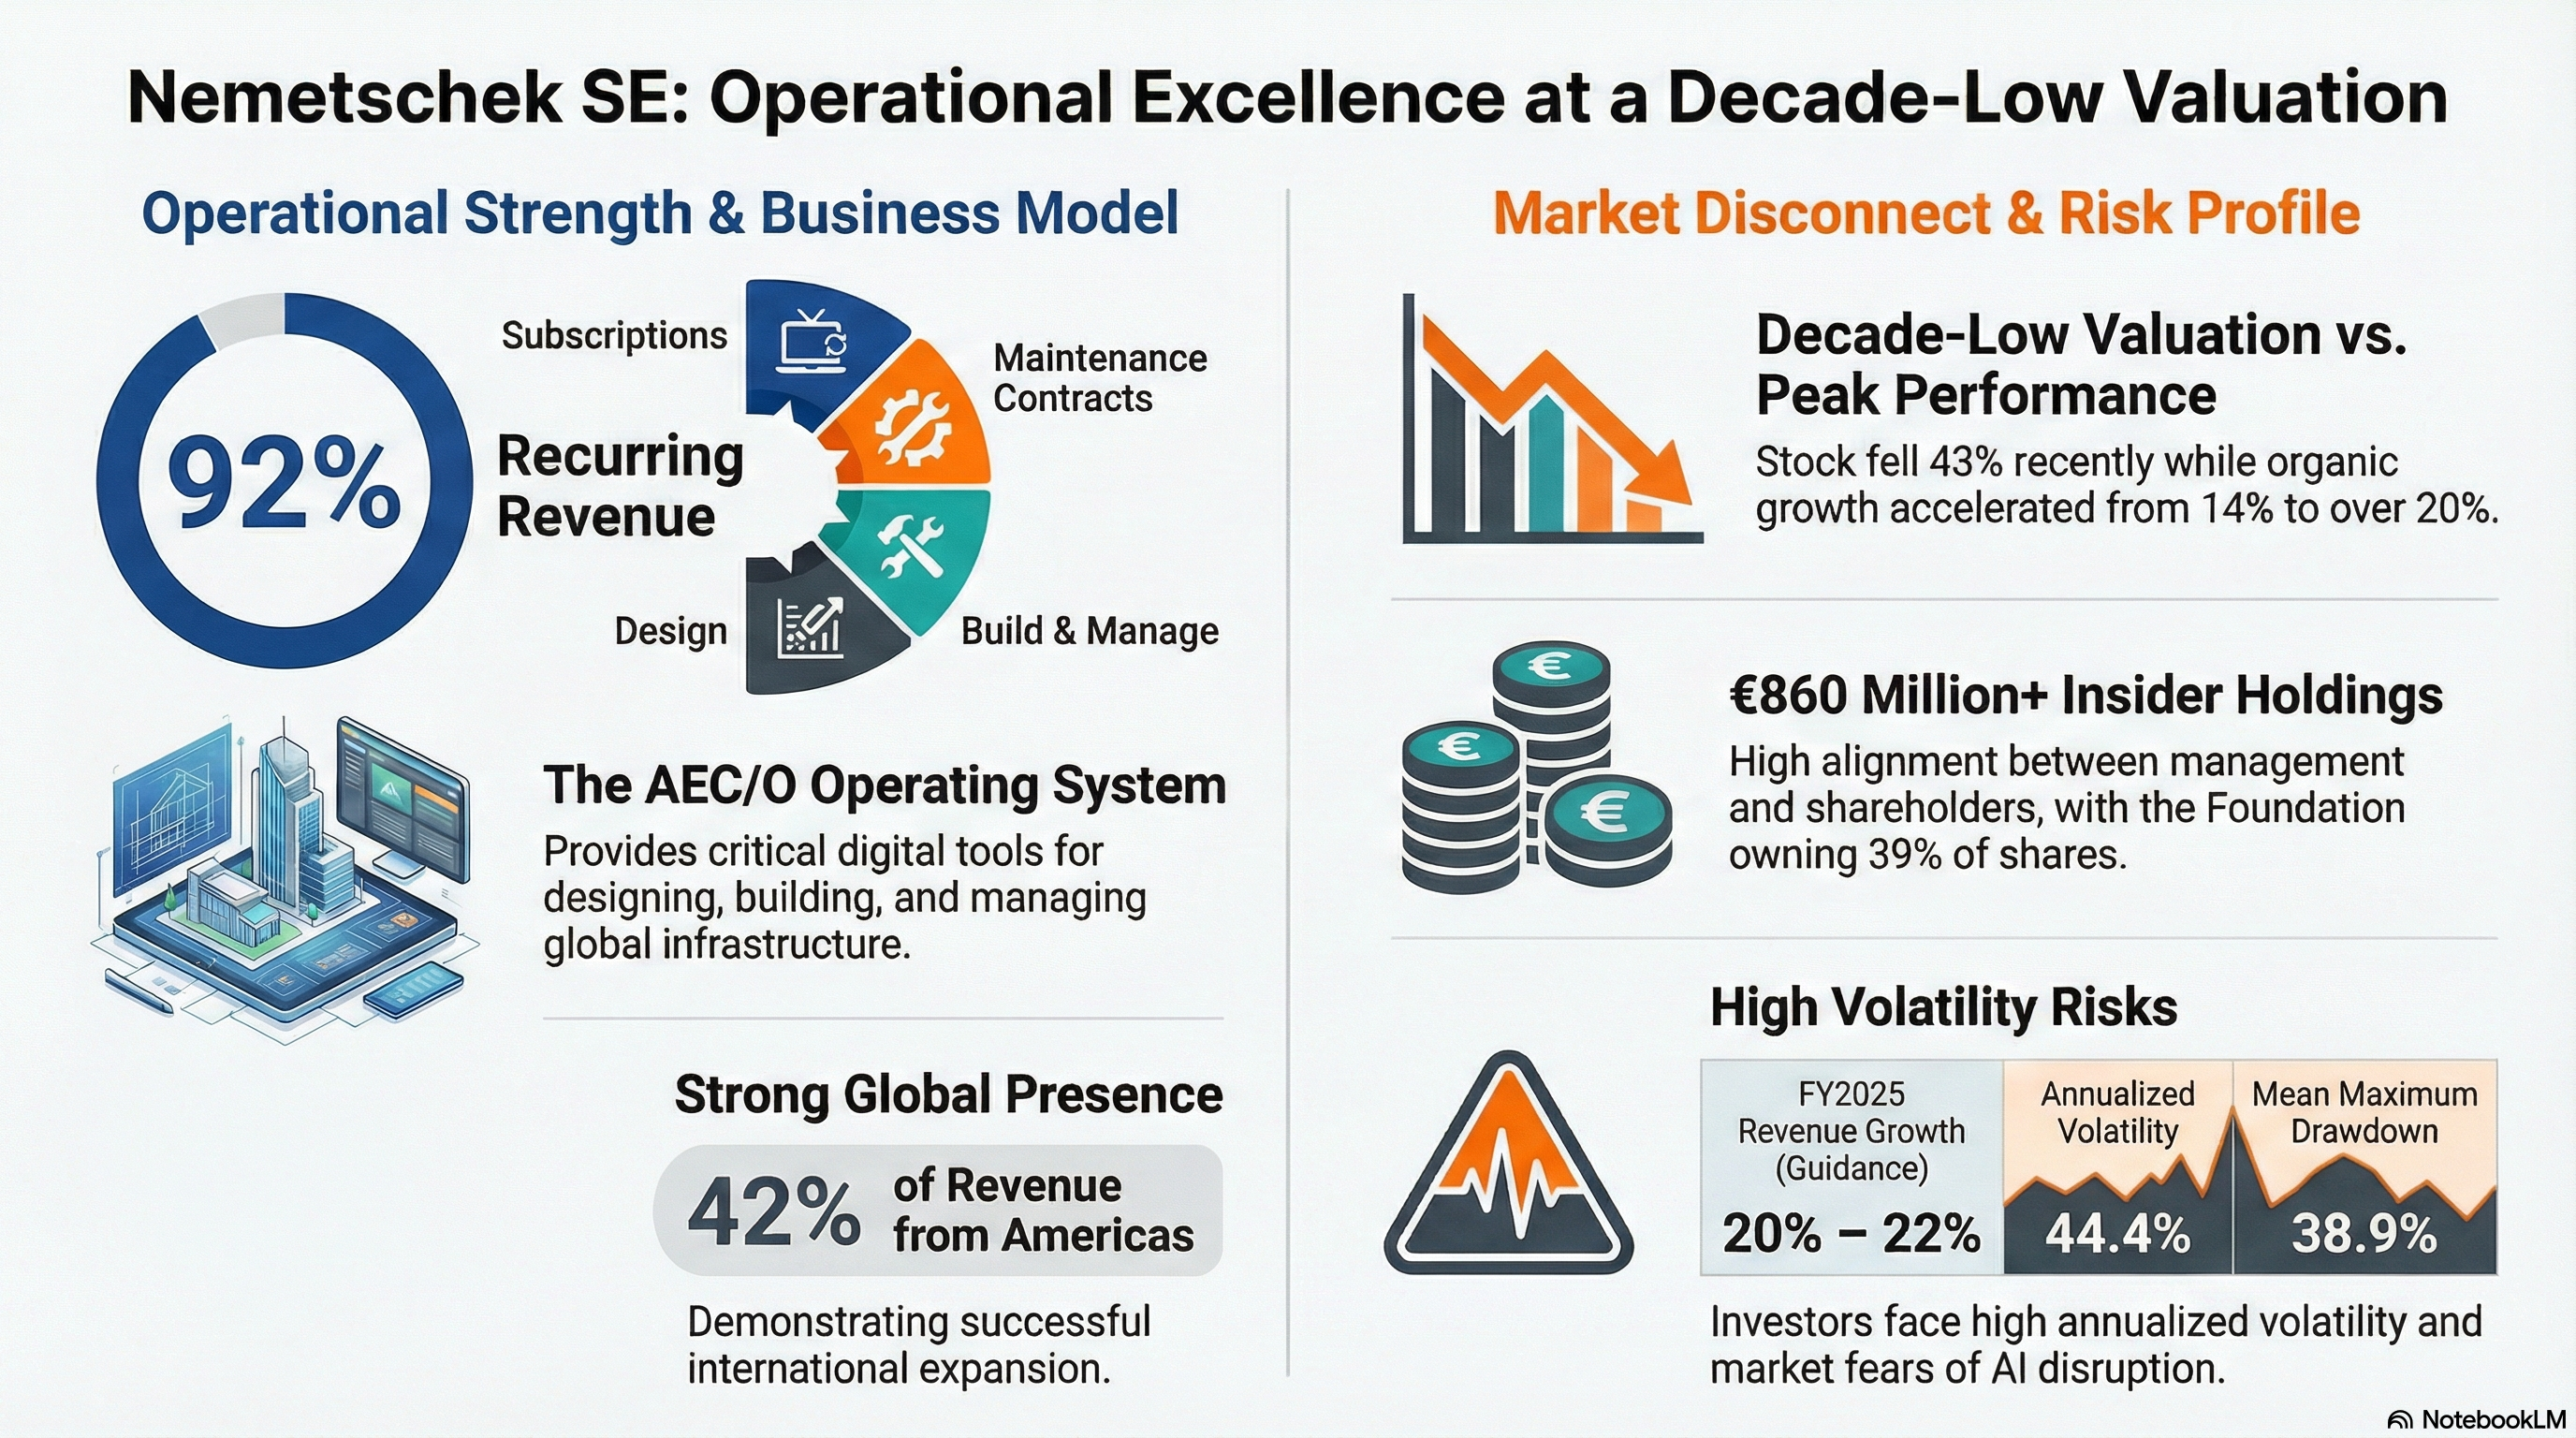
Nemetschek SE is a Munich-based software company that provides digital tools throughout the architecture, engineering, construction, and operations (AEC/O) lifecycle. It serves as an operating system for designing, building, and managing buildings. The company is organised into four segments: Design (including Graphisoft, Allplan, Vectorworks), Build (Bluebeam, GoCanvas), Manage (Spacewell), and Media (Maxon). Most of its revenue—92%—comes from recurring sources such as subscriptions and maintenance contracts, ensuring a stable and growing income stream.
The company trades on XETRA under the symbol NEM. The Nemetschek Foundation owns about 39% of the shares, and insider holdings exceed €860 million, aligning management and shareholder interests. The Americas account for 42% of revenue, highlighting its truly global presence despite its German origins.
Over the past six months, the stock has fallen around 43%, pushing valuation multiples to the lowest percentile of its ten-year history. This means the stock has never been cheaper relative to its earnings, cash flow, or enterprise value over the past decade. Yet, operationally, the business is performing at or near its peak. Revenue growth has accelerated from a 14% organic rate in fiscal 2024 to upward guidance of 20–22% on a foreign exchange-adjusted basis for fiscal 2025.
But the risk is real: annualised volatility of 44.4%, a mean maximum drawdown of 38.9%, and a Sharpe Ratio below the conviction threshold remind us that the path to those returns may be uncomfortable. The question the investor must answer is whether the market’s fear of AI disruption and construction cyclicality has created an opportunity to buy operational excellence at a temporary discount, or if these concerns are early indicators of a more lasting reassessment.
The Fundamentals
Nemetschek’s balance sheet is very solid. Net debt is only 0.6x EBITDA, a moderate figure influenced by the €700 million GoCanvas acquisition in July 2024. The Altman Z-Score of 8.36 shows the company is well above the danger zone of 3.0. With M&A capacity of €2.0–2.5 billion, Nemetschek has significant strategic flexibility for an acquisitive player in a fragmented market.
The 0.81% dividend yield positions the company at the 17th percentile versus regional peers—modest but aligned with its growth-focused capital policy. Instead of regular distributions, Nemetschek favors earnings reinvestment, which makes sense given its current growth trajectory.
Margins reveal ongoing structural improvement. The gross margin hit 56.2%, a decade high, due to the shift from perpetual licenses to higher-margin subscriptions. EBITDA margin is 27.1% (92nd percentile), and EBIT margin is 24.2% (87th percentile). Management expects about 31% EBITDA margin in 2025, supported by operating leverage as the subscription base expands.
Cash flow generation is arguably its strongest point. Free cash flow rose 44.5% year-on-year for the first nine months of 2025, with a cash conversion ratio over 111%, indicating the company turns more than one euro of operating profit into cash. The FCF yield of 4.83% ranks at the 100th percentile historically—mainly due to share price declines rather than weaker cash economics. The accrual ratio between -0.16 and -0.21 shows high earnings quality; profits are backed by real cash, not accounting tricks.
Return metrics are more nuanced. ROE at 24.2% (26th percentile), ROA at 8.5% (8th percentile), and ROTC at 12.0% (3rd percentile) are near their historical lows. However, this reflects the €700 million GoCanvas acquisition, which increased the capital base by 141% over five years, rather than operational decline. Compared to sector peers, these metrics still rank between the 79th and 83rd percentiles, meaning returns seem compressed only relative to Nemetschek’s impressive historic performance.
Valuation presents the most intriguing aspect. Compared to its own history, Nemetschek trades at the 0th percentile for P/E NTM, EV/EBITDA NTM, and P/FCF—its cheapest in a decade across all these metrics. Yet, relative to sector peers, it commands a premium: the 94th percentile for P/S NTM and 84th for EV/EBITDA NTM. This duality captures the core tension in its investment case.
Between the Lines
The 43% drop over six months has been driven more by external factors than company-specific issues: concerns about AI disrupting the AEC/O software market, tariff-related uncertainties impacting the US construction cycle, and a broader shift away from European tech stocks.
However, the actual data presents a different perspective. Revenue growth has sped up, guidance has been increased, margins are improving, and cash conversion remains exceptional. The Build segment, led by Bluebeam and now also by GoCanvas, grew 47% in the first nine months of 2025. Management has habitually conservative guidance—fiscal 2024 organic revenue reached 14%, surpassing the initial 10–11%, and ARR grew 34.6%, exceeding the guidance of over 25%.
Is the market justified in fearing these high growth rates are unsustainable, or has investor sentiment gone too far? The optimistic view is based on Nemetschek’s proven performance, the ongoing digitization trend in AEC/O, and a valuation that seems to ignore future growth despite strong evidence otherwise. Conversely, the cautious view suggests that sector premiums, though reduced, still exist—and risks from AI disruption, cyclicality in construction, and GoCanvas integration are possible. Investors need to evaluate which story is better supported by fundamentals.
Risk Modeling
The quantitative framework employs a Monte Carlo simulation over 252 trading days, utilizing a t- Student distribution with GARCH volatility to account for fat tails and volatility clustering. It assumes an equilibrium drift of 6.88% annually, combining the risk- free rate with the equity risk premium.
The simulation indicates a 60.6% chance of positive returns over the horizon, meaning about three out of five paths finish above the current price. The median outcome shows a +13.9% gain, suggesting moderate upside potential.
However, the risk measures require careful consideration. The 95% Value at Risk (VaR) is 48.5%, implying that in the worst 5% of scenarios, the stock could lose nearly half its value. The Conditional VaR (CVaR 95%) of 57.4% reflects the average loss in these extreme cases, highlighting significant tail risk amid high volatility. The average maximum drawdown across simulations is 38.9%, with the 95 th percentile reaching 61.5%. These figures emphasize risk, despite a generally positive bias.
The Omega Ratio of 1.89 stands out as a key risk- reward indicator. Unlike the Sharpe Ratio, which treats all volatility equally, the Omega Ratio considers the entire return distribution by comparing weighted gains above a threshold to losses below it. A ratio of 1.89 indicates that for every euro of downside risk, there are € 1.89 of expected upside, favoring the investor. Ratios above 1.0 are generally attractive, with values over 1.5 seen as especially appealing.
This aligns with the Gain/Loss Ratio of 2.38, showing that on average, gains are 2.38 times larger than losses when profitable. The Sortino Ratio of 1.45 further confirms this favorable skew, as it focuses solely on downside deviation relative to returns. In contrast, the Sharpe Ratio of 0.38 is below the 0.50 threshold, as it equally penalizes upside volatility and downside
Model limitations: It’s important to note that dividend income is not included in the simulation, which would slightly improve all return metrics. Additionally, the model does not account for company- specific catalysts; it evaluates the probability distribution of price movements rather than the fundamental triggers that may drive them.
The Upside
The most immediate trigger is the launch of Bluebeam Max in the first quarter of 2026. Bluebeam is already the leading PDF markup and collaboration tool in the US construction industry, and Max offers a premium, AI-enhanced version. If early adoption rates are strong, it will give tangible proof that Nemetschek can monetize AI instead of being overtaken by it.
GoCanvas, which was acquired for around €700 million in July 2024, adds another growth driver. The company supports mobile workflow automation for construction field workers and related sectors. Management has already increased its expected contribution to revenue from 3.5 to 4.5 percentage points. If cross-selling with Bluebeam exceeds expectations, the Build segment’s 47% growth rate could be more sustainable than currently believed.
Apart from product-specific catalysts, the ongoing shift to subscriptions in the Design segment—about 50% of users have already switched—provides a multi-year growth boost. As Graphisoft and Allplan customers transition to subscription models, recurring revenue becomes more predictable, and the market's valuation of these revenue streams should rise.
The Downside
The AI disruption story is the biggest source of sentiment risk. In August 2025, a Barclays report questioning whether AI-native tools could replace incumbent AEC software caused an 11% drop in a single session. The risk isn’t that Nemetschek will be replaced overnight, the key point to watch is whether AI features will generate additional revenue or just protect existing market share. If Bluebeam Max adoption falls short in the first two quarters after launch, this will intensify the negative narrative.
US construction cyclicality poses a more concrete fundamental risk. With 42% of revenue from the Americas and the Build segment now being the company’s main growth driver, any tariffs or slowdown in housing demand could hit Nemetschek more heavily. Early warning signs include a slowdown in Build segment organic growth below mid-teens and management shifting from raising guidance to only reaffirming it.
The integration of GoCanvas involves execution risks typical of large acquisitions. The €700 million price has already pushed return-on-capital metrics to historical lows, and the market will react strongly if expected synergies are not achieved. The Media segment (Maxon), which grew only 1.3% in the first nine months of 2025, is underperforming, and its uncertain turnaround could dampen overall growth expectations. Lastly, currency risk is significant. With 42% of revenues from USD-linked markets, a substantial weakening of the dollar against the euro could cause headwinds.
DISCLAIMER
The information provided in this newsletter is for educational and informational purposes only and does not constitute investment advice, financial advice, trading advice, or any other type of advice. The content should not be interpreted as an offer, solicitation, or recommendation to buy, sell, or hold any financial instrument.
The author is not a licensed financial advisor, broker, or dealer and is not authorised or regulated by any financial supervisory authority. All investment decisions involve risk, including the potential loss of principal. Past performance is not indicative of future results. Readers should conduct their own research before making any investment decisions.