Vistin Pharma is Europe’s only dedicated producer of Metformin hydrochloride, the active ingredient in the world’s most prescribed diabetes drug. Based in Kragerø, Norway, the company holds about 10% of the global metformin API market — a position earned through decades of chemical manufacturing expertise, secured renewable energy contracts until 2032, and a strong regulatory moat that discourages competitors.
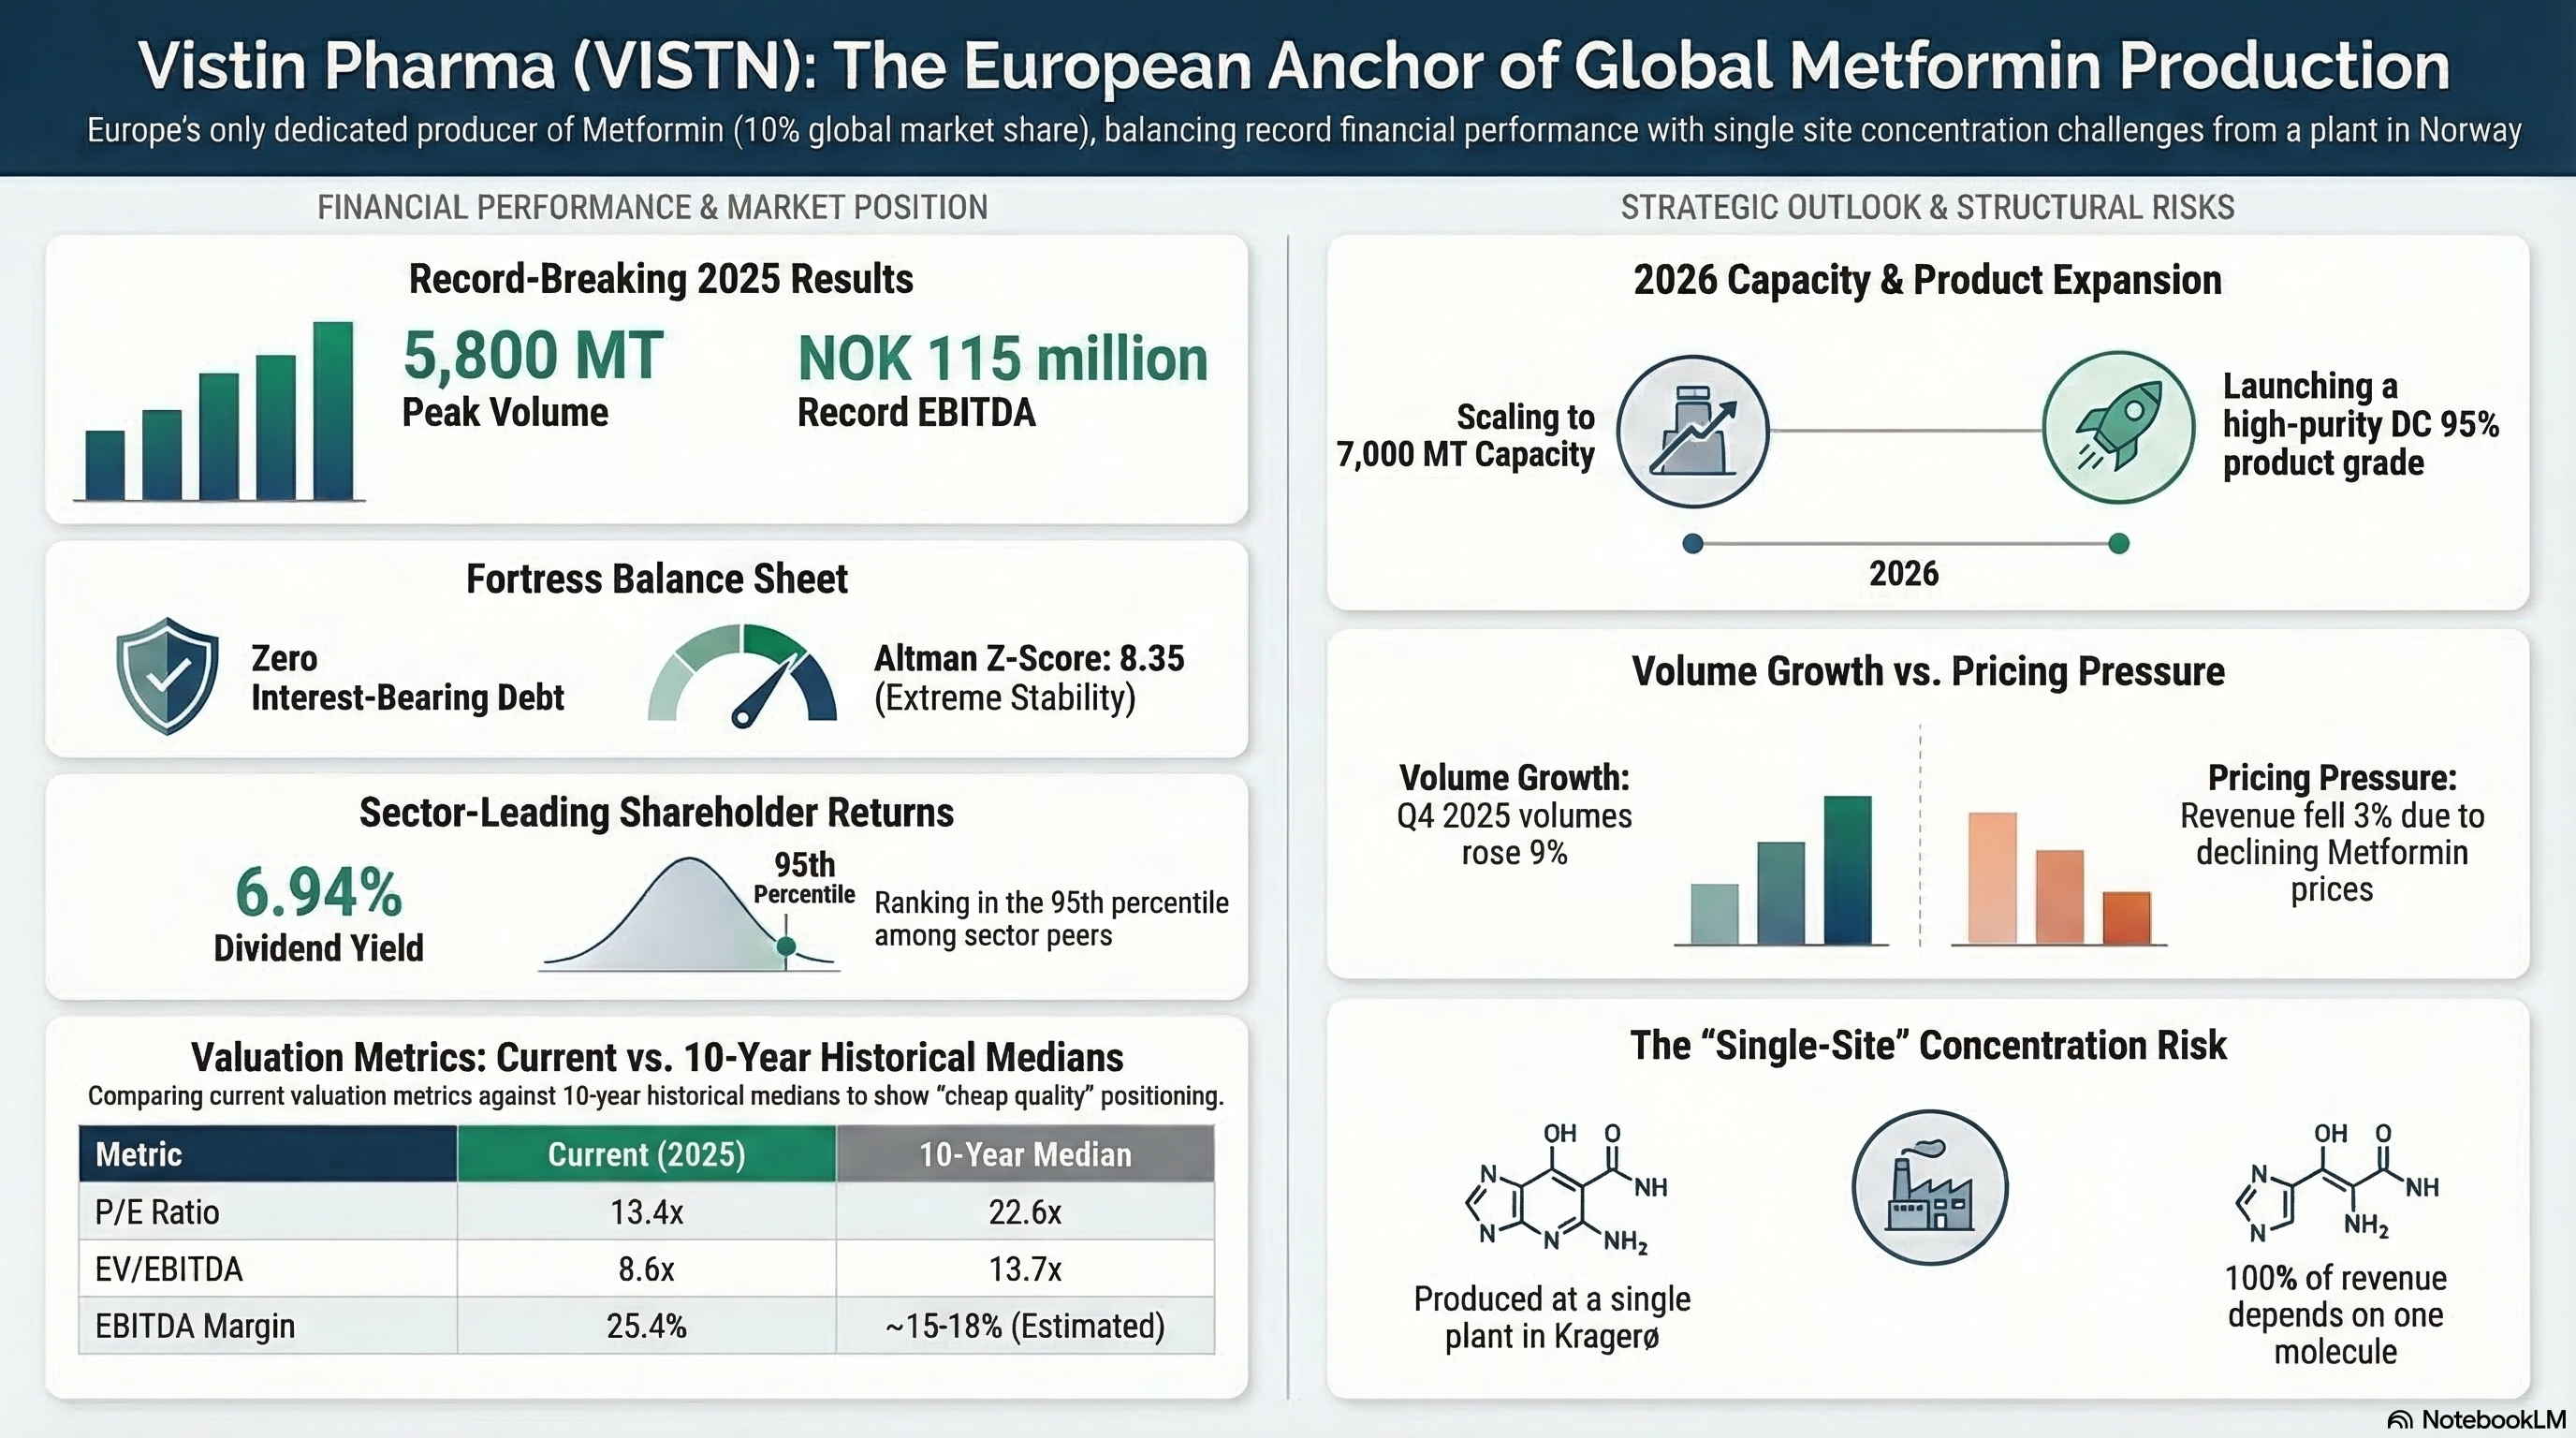
The stock trades on the Oslo Stock Exchange with the ticker VISTN at NOK 21.60, giving the company a market cap of roughly NOK 960 million. It recently posted its best year ever — record volume of 5800 metric tonnes, highest EBITDA of NOK 115 million, and a 19% increase in earnings per share.
As a small-cap company operating at full capacity, it returns substantial cash to shareholders, has no debt, and trades as if these factors are insignificant. The quantitative case appears more cautious — a neutral risk/return profile with expected returns barely exceeding the risk-free rate, supported by the Omega Ratio indicating that, although modest, the asymmetry favours investors.
Ultimately, Vistin Pharma tests investors' conviction: whether they believe that top-quality at a significant discount will eventually be recognised, or whether the market’s lack of interest is just the cost of being a NOK 960 million company producing a single molecule in one plant in southern Norway.
The Fundamentals
Vistin has no interest-bearing debt, maintains a 75% equity ratio, and ended 2025 with a positive net cash position of NOK 16 million. The Altman Z-Score is 8.35, well above the 3.0 threshold indicating financial stability. Practically, this means the company can endure a prolonged downturn without needing to raise capital or renegotiate covenants.
Profitability metrics are at or near historical highs, with an EBITDA margin of 25.4%, placing it in the 95th percentile over the past ten years. Return on total capital is 18.0%, at the 97th percentile. Gross margins have increased to 66.5%, well above the 60% target, supported by volume growth, water recycling efficiencies, and favorable energy costs through the Statkraft contract.
Cash flow remains robust, with a free cash flow yield of 6.17%, ranking at the 51st percentile historically, enough to pay a dividend of NOK 1.50 per share—offering a 6.94% yield at the current price, which ranks at the 92nd percentile historically and 95th among sector peers.
The P/E ratio of 13.4x is at the 19th percentile compared to the ten-year median of 22.6x. Enterprise value to EBITDA stands at 8.6x, at the 14th percentile versus a median of 13.7x. Similarly, these metrics are compressed compared to sector peers: P/E at the 22nd percentile and EV/EBIT at the 15th.
Between the Lines
FY 2025 achieved record EBITDA, high volumes, and margins that exceeded management’s targets. The global metformin market is growing at 4–6% annually, fueled by the diabetes epidemic. The company is increasing capacity toward 7,000 metric tonnes and plans to introduce a new DC 95% product grade in 2026, potentially expanding customer segments.
However, all revenue depends on a single molecule produced at one location, a concentration risk that operational excellence alone cannot eliminate. The Q4 2025 results showed a subtle warning: despite a 9% volume increase, revenue fell 3% YoY, indicating that metformin price declines are hurting top-line growth even with peak factory throughput.
In a market where over 68% of production is in Asia-Pacific—India accounting for about 38% and China nearly 30%—Vistin's European base stands out. But being distinctive isn’t the same as being protected. As CEO Magnus Tolleshaug noted in the Q4 2025 earnings call, metformin is a commodity drug. Vistin brands itself as a premium, high-quality supplier with pricing to match. Its products have no detectable nitrosamine levels and very low residual impurities—quality features valued by regulated pharmaceutical buyers in Europe and North America.
The company’s green energy contract with Statkraft, valid through 2032, offers cost stability many Asian competitors lack. Its ESG credentials provide a soft but tangible advantage. Nonetheless, this isn’t a traditional economic moat: no patents protect this decades-off-patent molecule, no network effects exist, and low switching costs mean customers could easily qualify alternative suppliers. Vistin’s real advantages are regulatory approvals, geographic scarcity, a strong reputation for quality, and cost predictability—forming a meaningful, though narrow, competitive advantage.
Any analysis of a metformin producer must consider the impact of the GLP-1 revolution. Novo Nordisk's semaglutide (sold as Ozempic for diabetes) and Eli Lilly's tirzepatide (sold as Mounjaro for diabetes) have transformed the type 2 diabetes treatment landscape. Both deliver better glycemic control, notable weight loss, and proven cardiovascular and kidney benefits that metformin cannot match on these fronts. Nonetheless, metformin remains an oral, daily tablet, generic, and costs less than $10 monthly, whereas semaglutide and tirzepatide can cost several hundred dollars monthly. In practice, these approaches are more complementary than replacing each other—semaglutide and tirzepatide are mainly added when metformin alone is insufficient.
Metformin continues to be the primary first-line treatment for most type 2 diabetes patients, especially in low- and middle-income countries where its cost advantage is also structural, not just commercial. For a metformin maker like Vistin, the real concern is not an existential threat but margin pressure: as GLP-1 agonists target higher-value patients in developed markets and metformin moves into the cost-sensitive lower segments of treatment, the pricing premium that supports Vistin's margins may face further challenges.
Investors should watch not just for a decrease in metformin prescriptions overall but for a shift in demand towards lower-value, price-sensitive markets where Vistin's premium European positioning provides less protection.
Risk Modeling
Our Monte Carlo simulation analyzed 100.000 paths over a 126-trading-day period using a hybrid GARCH / Historical Flexible Probabilities model calibrated to Vistin’s realized volatility. The model predicts a median return of +2.28 %, with a 53,9% chance of gains, and an average return of +5.70 %, boosted by significant positive skewness.
The interquartile range spans NOK 19,01 to NOK 25,80, showing a 31% return spread that highlights the uncertainty in a small-cap stock with an annualized volatility of 37,2%. The 95% value at Risk is -29,9%, while the Conditional Value at Risk in the worst 5% of cases reaches -36,8%. The average maximum drawdown of 21,6% indicates considerable intra-period volatility, even if the overall outcome is positive.
The Sharpe Ratio of 0,136 and Sortino Ratio of 0,179 suggest weak risk-adjusted returns under traditional assumptions. However, these metrics assume normally distributed returns. The simulated distribution shows positive skewness of 1,027 and excess kurtosis of 2,466, implying that large positive surprises occur more frequently than a normal distribution would suggest, with fatter tails.
This is where the Omega Ratio offers a clearer perspective. Unlike the Sharpe Ratio, which penalizes upside variability equally with downside risk, the Omega Ratio evaluates whether the total probability of gains above a set threshold exceeds that of losses below it. An Omega of 1,438 indicates that for every NOK 1 of expected shortfall, the position yields NOK 1,44 in expected excess gains. This confirms that the asymmetry slightly favors the investor, though not overwhelmingly. While the Sharpe Ratio may underestimate attractiveness by viewing beneficial volatility as risk, the Omega Ratio provides a more accurate reflection of the reward profile.
Model limitations: The Monte Carlo simulation assumes equilibrium drift (RFR + ERP). The simulation’s GARCH(1,1) framework captures volatility clustering but structural breaks (new product launch, strategic sale) could alter the volatility regime.
The Upside
The upcoming commercial launch of Vistin’s new DC 95% product grade is expected in the first half of 2026 and is a key development. DC 95% refers to a Direct Compressible metformin with 95% active pharmaceutical ingredient (API). Currently, Vistin produces a DC 92,6% grade. The new DC 95% variant contains a higher API concentration, which reduces the need for excipients and simplifies tablet manufacturing for customers. This higher-purity metformin targets customer segments that have not been previously served. A successful launch could diversify Vistin's revenue streams and demonstrate its pricing power beyond the commodity market.
The capacity increase to 7.000 metric tonnes is another key factor. Vistin produced 5.800 MT in 2025 and plans to expand further in 2026. Achieving full utilization at this level, with stable margins, would directly boost earnings without needing additional capital investments beyond the NOK 25–27 million guidance.
Changes in U.S. tariffs on Indian and Chinese pharmaceutical ingredients may shift demand toward European API producers. Vistin, as Europe’s only dedicated metformin producer, stands to benefit. Trends in nearshoring and ESG preferences in Europe further support this advantage.
Lastly, during the Q4 2025 earnings call, discussions arose about a potential sale of CF Pharma’s stake. If formalized, this could lead to a market reassessment, as strategic buyers might value Vistin’s monopolistic European position, strong balance sheet, and contracted energy supply at levels above the current market price.
The Downside
The immediate and measurable risk is the decline in Metformin prices. In Q4 2025, the trend was clear: volumes rose by 9%, but revenue fell by 3%, showing that decreasing per-kilogram prices are outpacing volume increases. If this continues — possibly due to Asian overcapacity or aggressive pricing by competitors — EBITDA margins could drop below 22%. This shift would change Vistin’s valuation from “cheap quality” to “cheap for a reason.” The main indicator to watch is a consistent quarterly decline in revenue.
A single-facility reliance creates a structural risk that no operational metric can fully mitigate. The Kragerø plant is Vistin’s only production site, and issues caused by Storm Amy in 2025 — such as batch scrap and production limits — underscore the tail risk of relying on a single location. Any prolonged disruption may severely affect the company’s ability to meet customer contracts.
The final capacity expansion to 7.000 MT is not guaranteed. Management described this process as technically difficult, and any delays could hinder the volume growth supporting the bullish outlook. Consistent drops in quarterly production below 1.400 MT would signal that the ramp-up is behind schedule.
Finally, as a small-cap with low liquidity, the stock faces valuation discounts but also operational risks. With a market cap under NOK 1 billion and limited daily trading, acquiring or exiting a large position can be costly. While this does not threaten the company's fundamentals, it poses genuine risks for investors involved.
DISCLAIMER
The information provided in this newsletter is for educational and informational purposes only and does not constitute investment advice, financial advice, trading advice, or any other type of advice. The content should not be interpreted as an offer, solicitation, or recommendation to buy, sell, or hold any financial instrument.
The author is not a licensed financial advisor, broker, or dealer and is not authorised or regulated by any financial supervisory authority. All investment decisions involve risk, including the potential loss of principal. Past performance is not indicative of future results. Readers should conduct their own research before making any investment decisions.